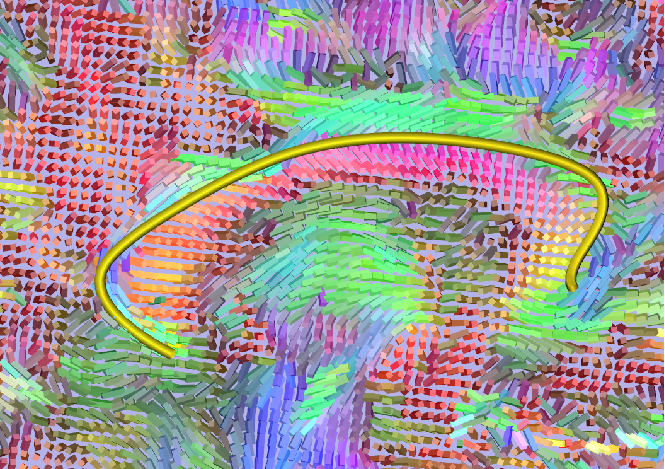
Visualization Paths of Interest (POI)

Pathways calculated by dmri_poistats can be visualizated by scuba2. The path can be visualized as an isosurface or as a tube and various parameters can be changed when in different modes.
Loading Pathways
After launching scuba2, load a path by:
Go to File->Load Path... This will open a file browsing window.
Navigate to the directory containing your optimal path data as generated by poistats. This will probably be the output directory that you specified when running dmri_poistats. Make sure that the volume named OptimalPathDensity, OptimalPath.txt, and OptimalPathSamples.txt are in the directory.
Select the OptimalPathDensity volume and click Open.
This will load your pathway into scuba2.
Display Options
In the Display Layer you have two modes of interaction, 2D and 3D. You can switch between 2D and 3D mode by selecting either the 2D or 3D radio buttons in the View panel. The default is a surface rendering of the path rendered as a thresholded surface--an isosurface. In 2D mode, you'll see the path as an outline of where the current slice intersects with the surface. In the 2D and 3D mode you can configure the following:
Opacity: Changes the transparency of the visualization.
Set Color...: This changes the color of the path visualization. When you click on the button, a new window opens where you can adjust the amount of red, green, and blue to create a new color for your path. The default is a blue path.
Threshold: Changes the threshold used to define the path. The two options are:
Low: Sets the threshold to be that of a low value, thus creating a fatter path.
High: Sets the threshold to be that of a high value, thus creating a thinner path.
In 3D mode, you gain a tube representation of the path. While in 3D Mode, you get the following additional options:
Mode: Changes the path representation.
Probability Tube: Represents the path as a tube based on the voxel coordinates specified in OptimalPath.txt, using the transform specified in the OptimalPathDensity volume, and using the probabilties of the path as specified in OptimalPathProbabilities.txt as the scalar values.
Sampled Tube: Represents the path as a tube based on the voxel coordinates specified in OptimalPath.txt, using the transform specified in the OptimalPathDensity volume, and using the sampled values along the path as specified in OptimalPathSamples.txt.
Threshold: Creates a surface based on the OptimalPathDensity volume.
Scale Tube Radius: Scales the radius along the tube based on the scalar values, either the probabilities or the samples. The tube will be fatter in locations of high values and thinner in locations of small values.
Color Tube Radius: Color the tubed based on the either the probabilities or the samples, as specified in the Mode.
Hints
- Load DTI to give the pathway context.
- Turn off scaling and coloring of the tube if you're not interested in the underying scalar data.
- When looking at multiple paths, set different colors.
