Up to ScubaGuide |
Back to ScubaQuickStart |
Continue to ScubaTools |
The Main Window

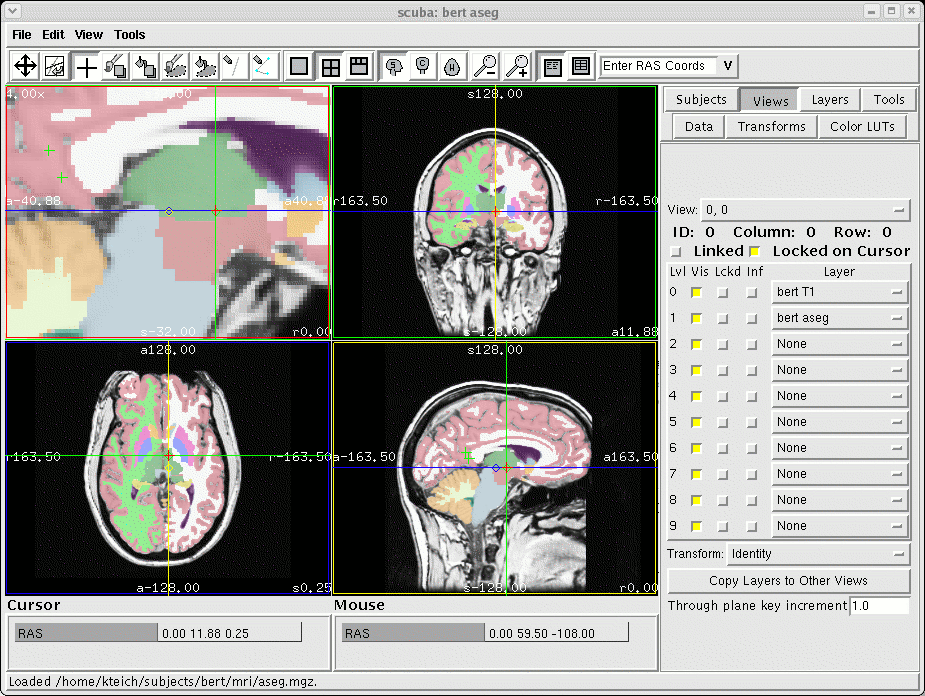
The scuba window has a menu bar at the top, a row of toolbar buttons, the main view on the left, the control panels on the right, an information area below the main window, and a status bar at the bottom.
Most control panels allow you to configure settings for an item, such as a layer, view, tool, or data collection. The items you can configure are listed in a pull-down menu at the top of the panel; for example, in the Layers panel, the pull-down menu contains a list of Layers. Make sure you select the item you wish to configure properly.
The toolbar contains buttons for selecting a tool, for setting the view configuration or number of views in the window, and buttons for setting the orientation of the current view.
Toolbar Buttons
|
Navigation tool |
|
Rotate viewing plane tool |
|
Marker tool |
|
Edit volume tool |
|
Fill volume tool |
|
Edit ROI tool |
|
Fill ROI tool |
|
Straight path tool |
|
Edge path tool |
|
Single view |
|
2,2 view |
|
3,1 view |
|
X plane view |
|
Y plane view |
|
Z plane view |
|
Show label area as a list |
|
Show label area as a table |
|
Zoom out |
|
Zoom in |
Label Area
Underneath the label area is where information about the voxel or data element underneath the cursor and current mouse location is printed. This information can be laid out in a list or a table. The list is fixed width but increases downwards as more information is displayed, and the table takes up more horizontal space but is useful for comparing values in multiple volumes.
To display data information in this area, check the checkbox in the Inf column in the Views panel. Also make sure that the Report Info checkbox is enabled in the Layers panel for that data collection.
Some label values are also editable fields. For these fields, you can enter new values. For example, typing in coordinates in the cursor area coordinate displays will move the cursor to that new location.
Control Panels
The right side of the main window is the control panel. Buttons at the top of the panel select the current controls.
Subjects |
This panel scans your SUBJECTS_DIR, if set, and lists the subjects found there. It then scans available data types in the subject's subdirectories and lets you quickly load them. |
Views |
This panel allows you to configure a view. The pull-down menu at the top selects the view to configure. You can specify which layer is to be drawn at each draw level, and whether that level is visible, locked to shuffling, or reporting info. |
Layers |
This panel contains settings for individual layers. Choose a layer to configure in the pull-down menu at the top of the panel. Layer settings or dependant on the layer type; volume, or 2DMRI, layers have controls for setting the color mapping, brightness, contrast, LUT, and other settings. |
Tools |
This panel configures the parameters for the current tool. You can choose the current tool by clicking the tool button in the toolbar or selecting it from the pull-down menu at the top of the panel. Some settings are shared between tools. |
Data |
The data panel allows you to configure the source data for a layer and manage ROIs associated with the data collection. Notably, here you can associate transforms with data, and create, delete, and configure ROIs. |
Transforms |
This panel displays the currently loaded transforms, and allows you to load and modify them. You can choose to the transform to modify with the pull-down menu at the top of the panel, or create a new one with the button on the bottom. |
Color LUTs |
This panel allows you to configure currently loaded color lookup tables (LUT), and load new ones. |
Note that with many text entry fields in these panels, editing the text inside the fields will cause the contents to turn red. This means that the contents have been modified but not committed. To commit changes, press the return key.
