Up to FreeviewGuide |
Back to FreeviewTools |
Continue to VoxelEdit |
Measure
Measure mode includes tools which allow you to accurately measure distance in any volume view using manually drawn lines of various shapes. These tools also allow you get the mean and standard deviation of voxel values encompassed within a manually drawn rectangular region. Lastly, you can find basic descriptive statistics for any segmentation volume (i.e., aseg.mgz) loaded into Freeview. You can easily copy or export the various measures obtained using any of the measure tools described below.
Measure mode is located just above the layer list and underneath the menu bar, or can be found under Action -> Measure in the menu bar. 
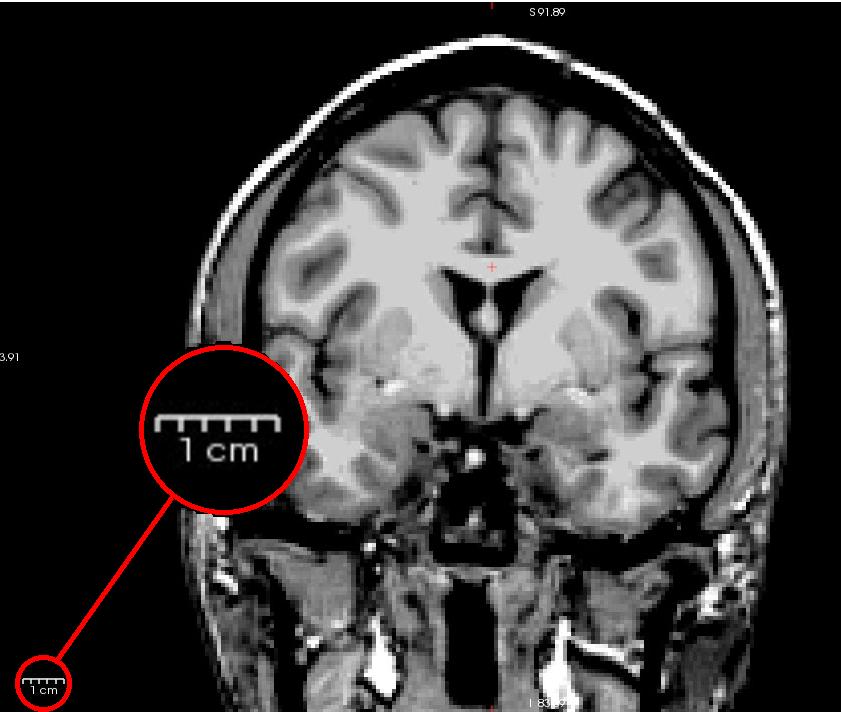
When a volume is loaded into Freeview, the volume header information is used to determine the size of each voxel. Freeview will display a scale bar in the lower left corner of the main display window, and will change depending on the zoom level you are viewing the volume with.
Selecting Measure mode will prompt the Measure pop-up window to appear, which will include the following button bar:

|
Measure using Line tool |
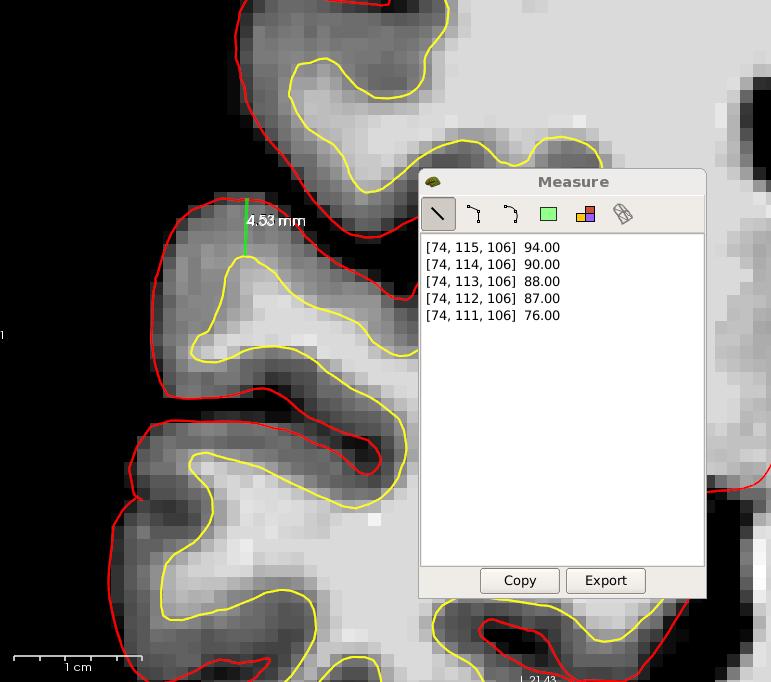
With the Line measure tool you can draw a straight line between two points to get a distance measurement. The intensities and RAS coordinates of voxels which the drawn line intersects are displayed in the Measure pop-up window. Note that these values will update automatically if you change slices. Below is an example of how you could use the Line tool to obtain a measure of cortical thickness for a specific region of the cortex.
|
Measure using Polyline tool |
Similar to the Line tool, with the PolyLine tool you can draw a series of points connected by straight lines resulting in the sum of the distance for each straight line segment of the PolyLine. With the tool selected, each successive left-click will create a new point and a new line segment. To end the PolyLine, right-click anywhere in the main display window. Similar to the Line measure tool, the intensities and RAS coordinates of voxels which each line intersects are displayed in the Measure pop-up window. Note that these values will update automatically if you change slices. Below is an example of how you could use the PolyLine tool to obtain a rough perimeter measurement of a certain sub-cortical structure.

|
Measure using Spline tool |
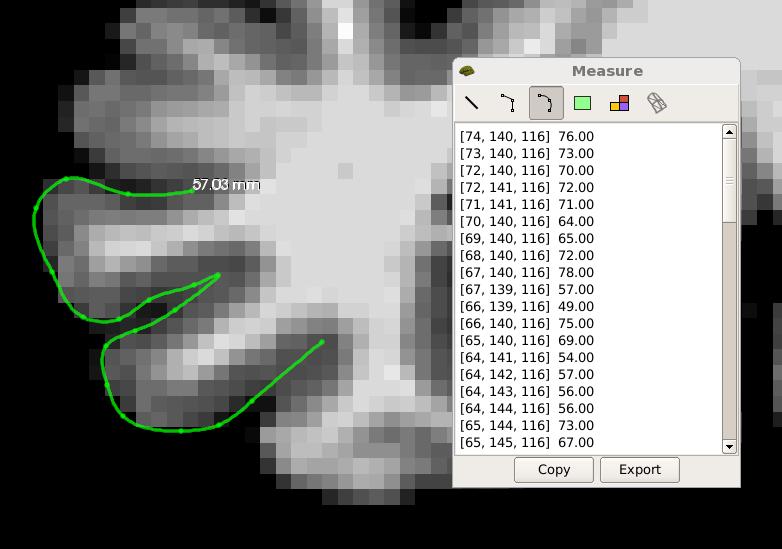
Similar to the PolyLine tool, the Spline tool allows you to draw a series of points connected by curved lines which adjust their positioning according to the placement of each sucessive point. You can think of it as a smoothed version of the PolyLine tool. With the tool selected, each successive left-click will create a new point and a new line segment. To end the spline, right-click anywhere in the main display window. The intensities and RAS coordinates of voxels which each spline intersects are displayed in the Measure pop-up window. Note that these values will update automatically if you change slices. Below is an example of how you could use the Spline tool to obtain a measure of distance between two points on the cortex.
|
Measure using Rectangle ROI tool |
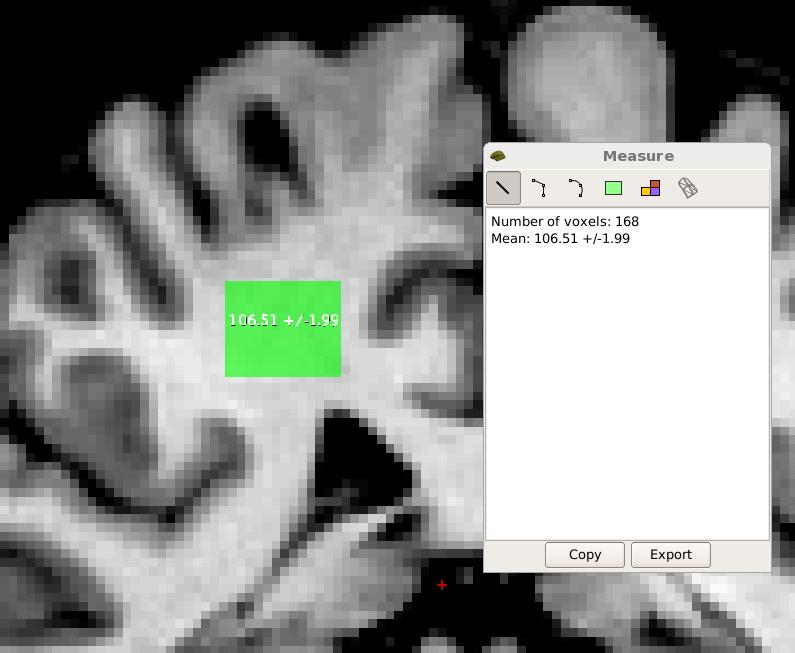
The Rectangle tool can be used to easily measure the mean and standard deviation of voxel value within a drawn rectangle. In addition to the mean and standard deviation, the total number of voxels encompassed in the drawn rectangle is also displayed in the Measure pop-up window. Note that these values will update automatically if you change slices. Below is an example of how you could get the mean and standard deviation of white matter voxel intensities.
|
View Segmentation/Label descriptive measures using Label tool (may be grayed out) |
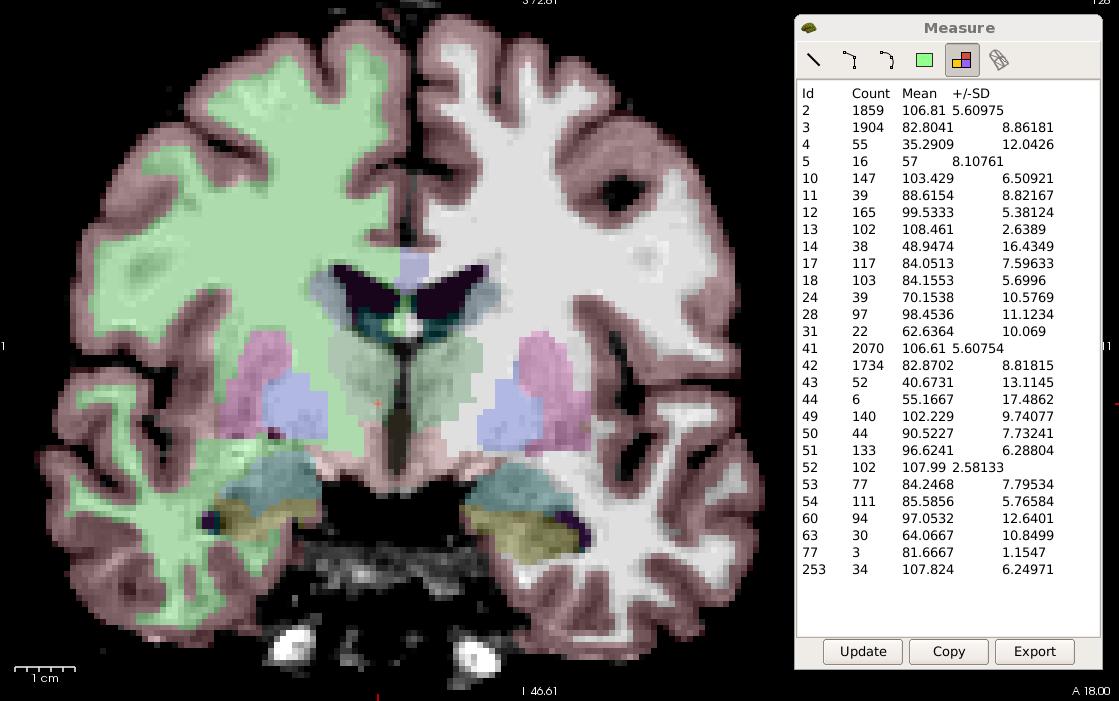
The Label tool button becomes active in the Measure pop-up window only when one or more volumes are loaded into Freeview with Lookup Table selected in the Color map drop-down menu. Most volumes when loaded into Freeview are set to display as Grayscale by default, and would need to be changed to display using a Lookup table (i.e., FreeSurferColotLUT by default) or include the :colormap= option in your Freeview command-line. Once at least one volume is set to display using a Lookup Table, a table will appear in the Measure pop-up window listing the ID number of each segmentation in the volume(s) with the corresponding total number of voxels, mean voxel value, and standard deviation of voxel values. The Label tool can be used to view descriptive information about sub-cortical structures appearing in the aseg.mgz volume, or to determine how many manual edits have been made to the white matter mask (wm.mgz) by looking at the total number of voxels with a value of 1 (wm voxels erased) and 255 (wm voxels added). The mean and standard deviation values are calculated using the volume closest to the top of the volume layer list which is not being displayed using a Lookup Table. So in order to use the Label tool you will need at least two volumes loaded into Freeview, one volume being displayed using a Lookup Table (i.e., aseg.mgz), and one volume being displayed using any other option in the Color map drop-down menu (i.e., norm.mgz with Grayscale as Color map). Below is an example of a table of values for all segmentations included in the aseg.mgz volume.
|
View IsoSurface region measures using IsoSurface Region tool (may be grayed out) |
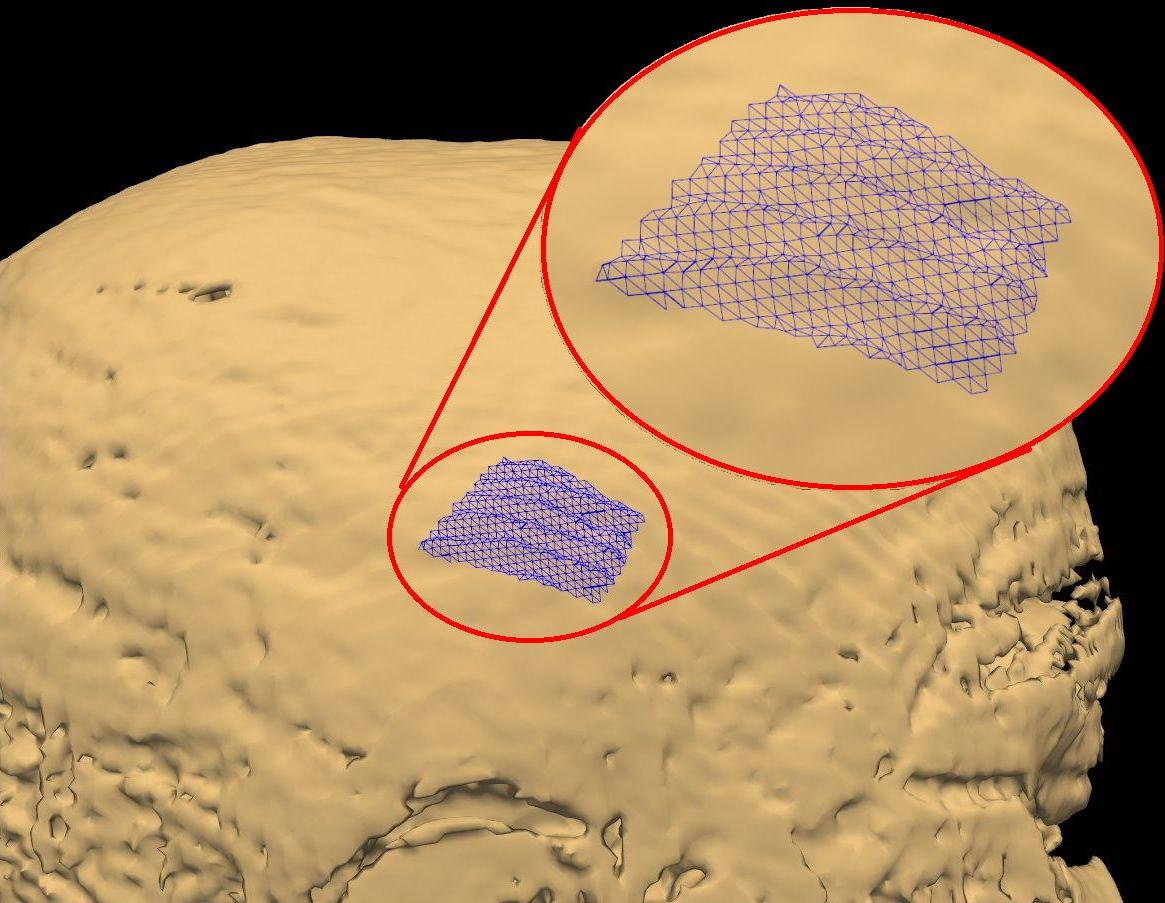
With the IsoSurface Region measure tool you can draw an ROI on the isosurface of a volume and then save the coordinates of the ROI. No descriptive statistics are provided within Freeview for the ROI. An isosurface can be generated for any volume by selecting the volume in the layer list, switching to the 3D view, and then clicking the Show as isosurface in 3D view checkbox. Adjust the low and high threshold sliders to fine-tune the isosurface. Once you are content with the anatomy being captured by the isosurface, you can draw an ROI by holding down the crtl key and slowly drawing your ROI. You can then save the ROI using the options in the Measure pop-up window.
