Up to TkSurferGuide |
Back to TkSurferQuickStart |
Continue to TkSurferViewingArea |
Interface
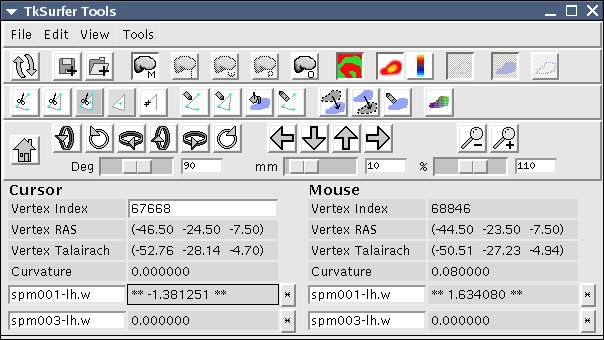
TkSurfer consists of two windows. The Display Window displays data. The Tools Window has toolbars, a menu bar, and display areas for the cursor and mouse location.
Display Window

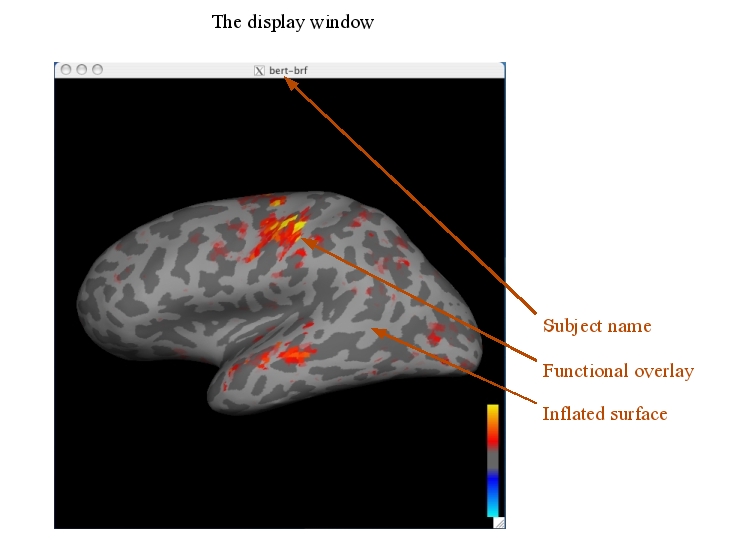
Here is a look at the Display window. From looking in the title bar, you can see that the subject is called bert-brf. Here we see an inflated hemisphere surface with a grayscale curvature overlay and a colored functional overlay.
Tools Window

The menu bar at the top of the Tools Window contains four menus. The File menu is for loading and unloading data and for saving changes. The Edit menu contains an undo item and selection utilities. The View menu contains options for specifying what data are displayed and configuring how these data are displayed. The Tools menu contains commands and utilities for working on data.
The top toolbar contains buttons for various cutting, drawing, and filling actions. Beneath that are three navigation panes used to rotate, translate, and zoom the view of the surface.
Main Toolbar
|
Redraw the screen |
|
Save the cursor position |
|
Load the cursor position |
|
Show the main surface |
|
Show the inflated surface |
|
Show the white surface |
|
Show the pial surface |
|
Show the orig(inal) surface |
|
Show the curvature |
|
Show the overlay |
|
Show the overlay color scale bar |
|
Show the labels |
|
Show the labels as filled shapes |
|
Show the labels as outlined shapes |
||
|
Save the current display as TIFF image |
|
Save all the 4 views of the current display as TIFF images |
Tools Toobar
|
Make a cutting line |
|
Make a closed cutting line |
|
Make a cutting plane |
|
Cut a contiguous area |
|
Clear all cuts |
|
Draw a path |
|
Draw a closed path |
|
Show the fill label dialog box |
|
Erase the current line |
|
Make a label out of marked vertices |
|
Mark the vertices in the current label |
|
Erase the current label |
|
Change the color of the current label |
Navigation Toolbar
|
Set the camera to the home position |
|
Rotate the view |
|
Translate or pan the view |
|
Zoom the view |
Beneath that is an area divided into halves. Each half displays information about the cursor (left half) or mouse location (right half). This area expands downwards are more data types are loaded and have information that need displaying. You can go directly to a vertex index by typing into the field labeled Vertex Index underneath the Cursor area.
The overlay information lines have editable fields that allow you to rename the overlays layers. Additionally, the button next to each one will switch to that layer.
